
我想用angular在piechart画布中传递API的输出,但是我无法获得任何结果,API被消耗,但是我有一个问题,将它与下面的代码piechart(数据点)关联起来。
App.Component.ts
import { Component, OnInit } from '@angular/core';
import { EmailValidator } from '@angular/forms';
import { Router, NavigationEnd } from '@angular/router';
import { ApiService } from './api.service';
import { ApistatService } from './apistat.service';
import * as CanvasJS from './canvasjs.min';
//var CanvasJS = require('./canvasjs.min');
@Component({
  selector: 'app-root',
  templateUrl: './app.component.html',
  styleUrls: ['./app.component.css']
})
export class AppComponent implements OnInit {
  elements: any[];
  constructor(
    private apistatService: ApistatService
  ) {
    this.elements = [];
  }
    ngOnInit() {
    let chart = new CanvasJS.Chart("chartContainer", {
        theme: "light2",
        animationEnabled: true,
        exportEnabled: true,
        title:{
            text: "Monthly Expense"
        },
        data: [{
            type: "pie",
            showInLegend: true,
            toolTipContent: "<b>{elements.total}</b>: ${y} (#status)",
            indexLabel: "{name} - #percent%",
            dataPoints: [

                { y: 120, name: "Insurance" },
                { y: 300, name: "Traveling" },
                { y: 800, name: "Housing" },
                { y: 150, name: "Education" },
                { y: 150, name: "Shopping"},
                { y: 250, name: "Others" }
            ]
        }]
  });
  this.apistatService.getData().subscribe((data:any) => {
    if(data.status === 200) {
      console.log(data.response);
      this.elements = data.response;
    }
  })
    chart.render();
    }
}
null
app.component.html
null
<div id="chartContainer"  style="height: 370px; width: 100%; margin-left:auto;margin-right:auto;">


</div>
null
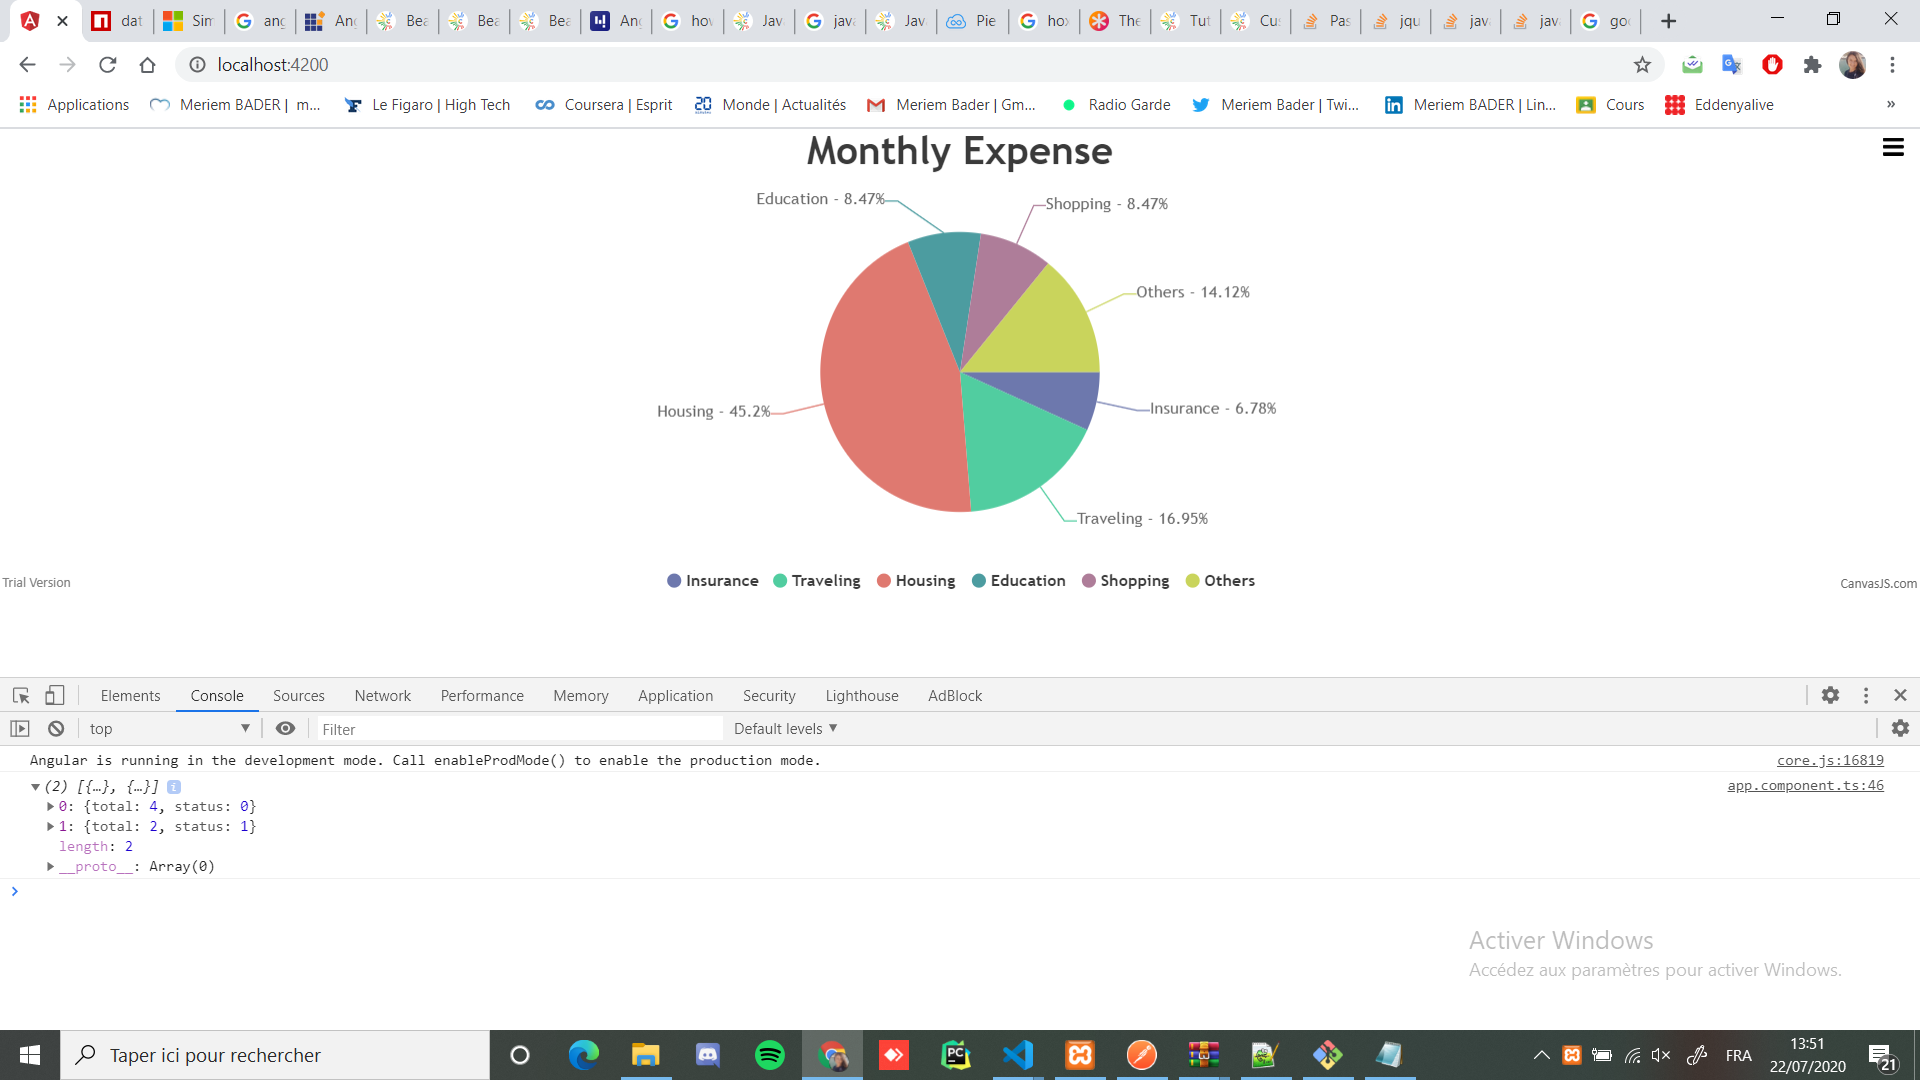
要在饼形图中使用API数据,您只需将数据从API设置为DataPoint数组,只需确保您的API数据具有与当前数据点数组中可用的格式相同的格式,您在呈现图表时将其传递到数据数组中,这样就可以工作了。
