
请使用以下代码来显示DataTable:
fluidRow(column(3,
                dataTableOutput(outputId="table01", width = '100px')))
这就是呈现表的创建方式:
output$table01 <- DT::renderDataTable({
df <- get_mp_data()
if(is.null(df)){
df <- data.frame()
}else{
upcolor = "lightblue"
downcolor = "lightblue"
col_name = "CHG"
df <- datatable(df
, rownames = FALSE
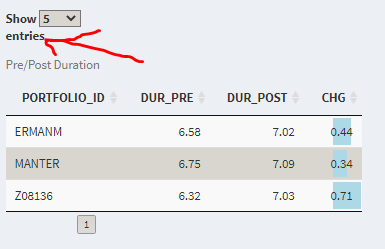
, caption = paste0("Pre/Post Duration")
, filter = 'none'
, options = list(scrollX = F
#, lengthChange = FALSE # this feature hides the "Show Entries" on top of the table, so we won't be able to customize how many entries we can see all together
, pagingType = "numbers" # this hides the Next and Previous buttons --> https://datatables.net/reference/option/pagingType
, autoWidth = T
,pageLength = 5 # this determines how many rows we want to see per page
, info = FALSE # this will hide the "Showing 1 of 2..." at the bottom of the table --> https://stackoverflow.com/questions/51730816/remove-showing-1-to-n-of-n-entries-shiny-dt
,searching = FALSE # this removes the search box -> https://stackoverflow.com/questions/35624413/remove-search-option-but-leave-search-columns-option
,columnDefs = list(list(width = '4', targets = c(3) )
,list(width = '4', targets = c(2) )
) # careful, column counting STARTS FROM 0 !
)) %>%
formatStyle(col_name,
#background = styleColorBar(range(df[, c(col_name)]), 'lightblue'),
background = color_from_middle(df[, c(col_name)] , downcolor, upcolor),
backgroundSize = '98% 88%',
backgroundRepeat = 'no-repeat',
backgroundPosition = 'center')
}
return(df)
})
您可以使用此选项:
datatable(iris, options = list(
  language = list(lengthMenu = "_MENU_")
))
