
我想用以下代码注释绘图最后一个方面的一些文本:
library(ggplot2)
p <- ggplot(mtcars, aes(mpg, wt)) + geom_point()
p <- p + facet_grid(. ~ cyl)
p <- p + annotate("text", label = "Test", size = 4, x = 15, y = 5)
print(p)
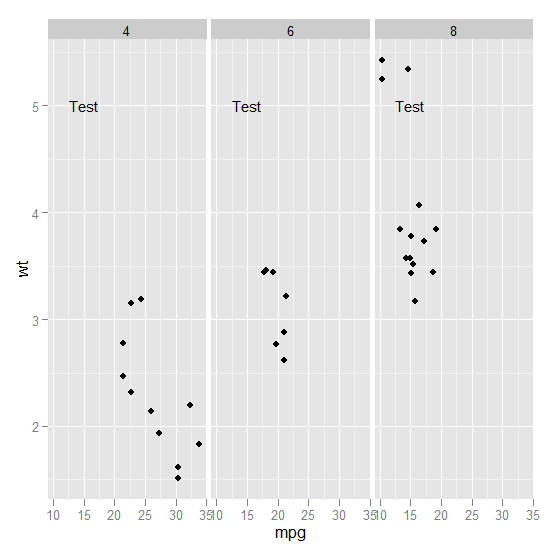
但是这段代码在每个方面注释了文本。我怎么能只在一个方面得到注释文本?
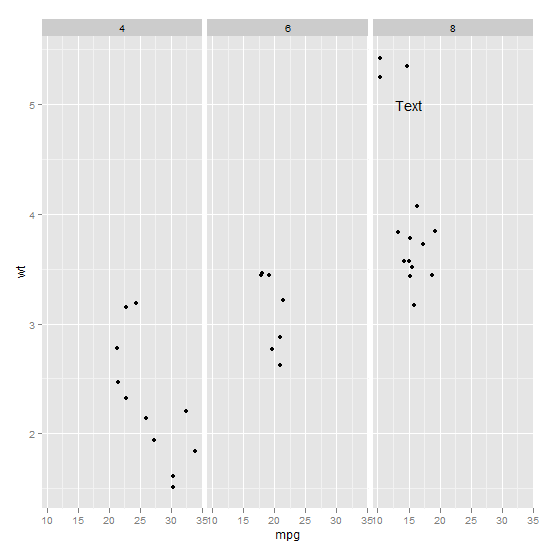
通常您会这样做:
ann_text <- data.frame(mpg = 15,wt = 5,lab = "Text",
                       cyl = factor(8,levels = c("4","6","8")))
p + geom_text(data = ann_text,label = "Text")
它应该在不完全指定因子变量的情况下工作,但可能会引发一些警告:
以下是没有文本注释的情节:
library(ggplot2)

p <- ggplot(mtcars, aes(mpg, wt)) +
  geom_point() +
  facet_grid(. ~ cyl) +
  theme(panel.spacing = unit(1, "lines"))
p
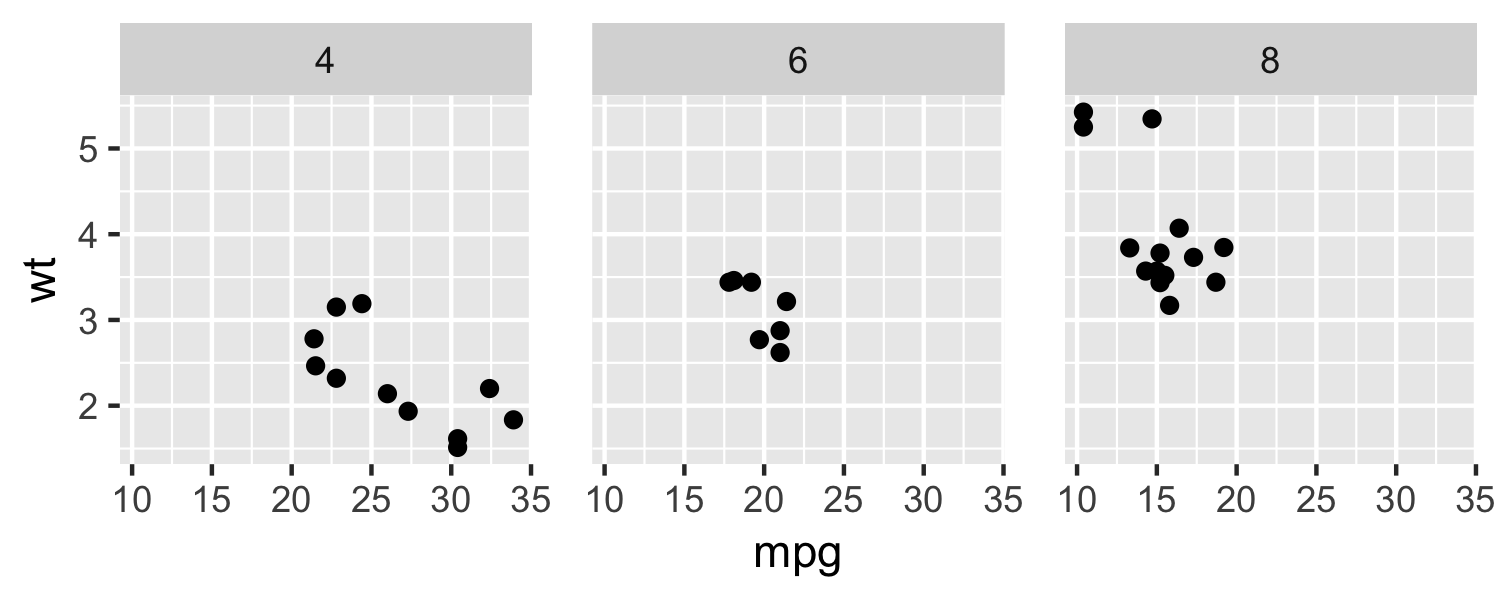
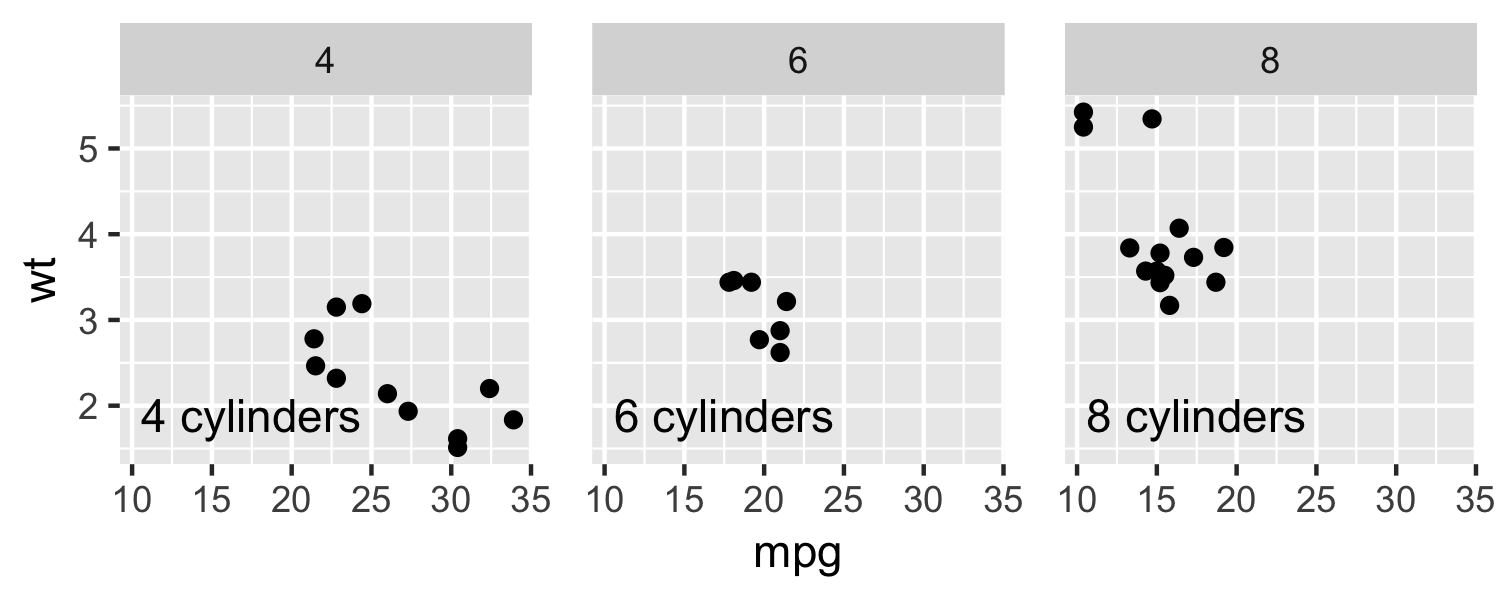
让我们创建一个额外的数据框来保存文本注释:
dat_text <- data.frame(
  label = c("4 cylinders", "6 cylinders", "8 cylinders"),
  cyl   = c(4, 6, 8)
)
p + geom_text(
  data    = dat_text,
  mapping = aes(x = -Inf, y = -Inf, label = label),
  hjust   = -0.1,
  vjust   = -1
)
或者,我们可以手动指定每个标签的位置:
dat_text <- data.frame(
  label = c("4 cylinders", "6 cylinders", "8 cylinders"),
  cyl   = c(4, 6, 8),
  x     = c(20, 27.5, 25),
  y     = c(4, 4, 4.5)
)

p + geom_text(
  data    = dat_text,
  mapping = aes(x = x, y = y, label = label)
)

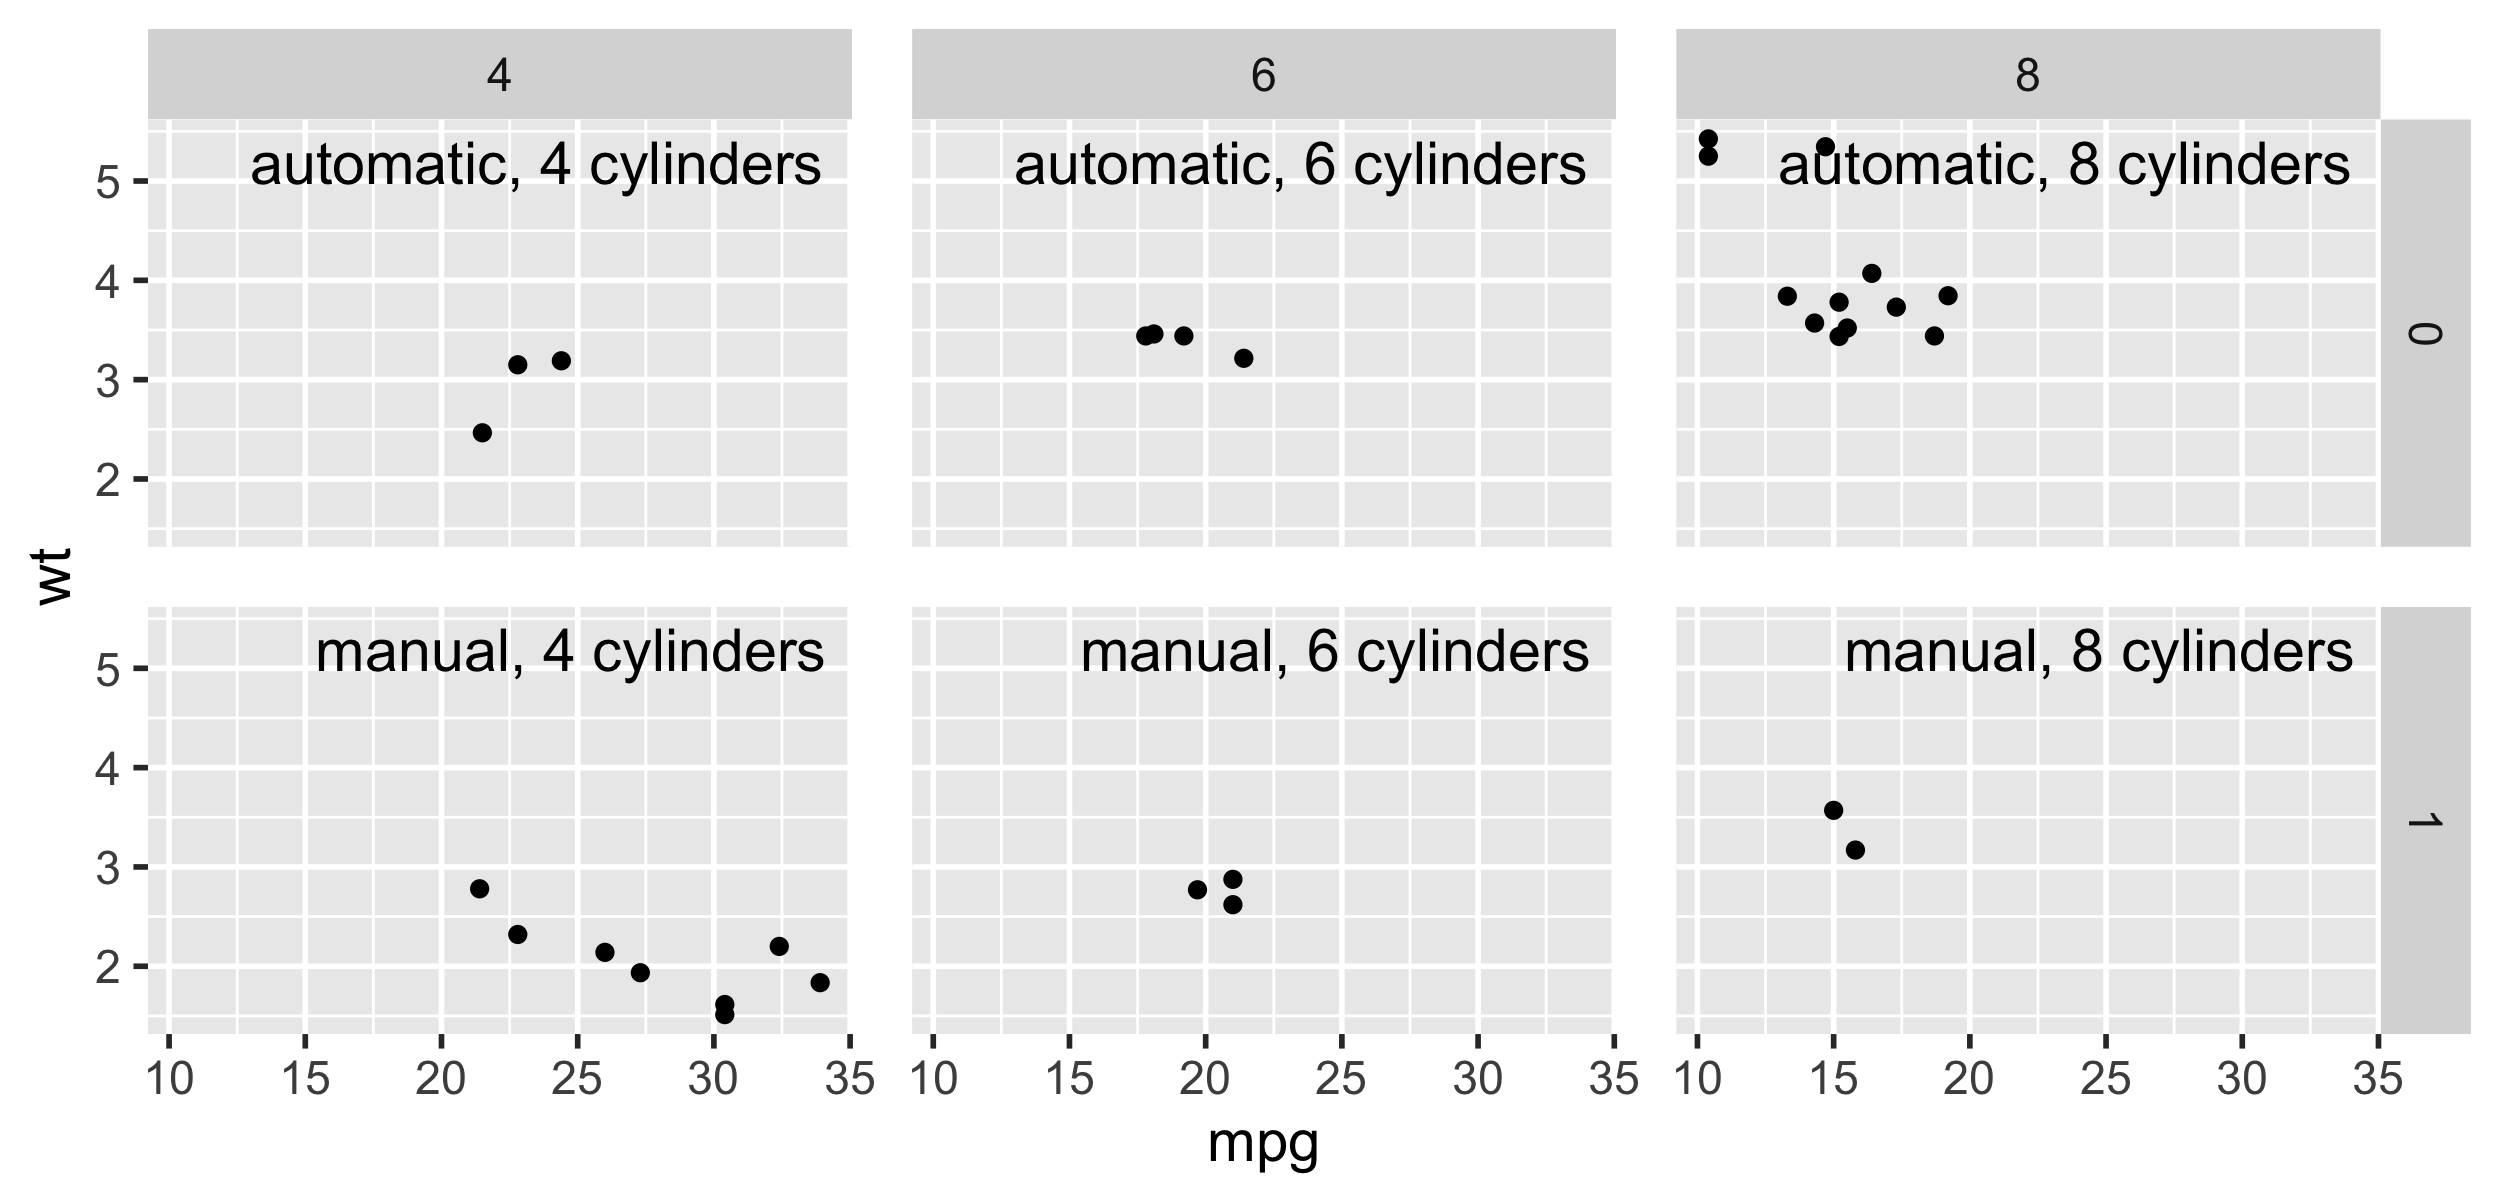
我们还可以跨两个方面标记图:
dat_text <- data.frame(
  cyl   = c(4, 6, 8, 4, 6, 8),
  am    = c(0, 0, 0, 1, 1, 1)
)
dat_text$label <- sprintf(
  "%s, %s cylinders",
  ifelse(dat_text$am == 0, "automatic", "manual"),
  dat_text$cyl
)
p +
  facet_grid(am ~ cyl) +
  geom_text(
    size    = 5,
    data    = dat_text,
    mapping = aes(x = Inf, y = Inf, label = label),
    hjust   = 1.05,
    vjust   = 1.5
  )
笔记:
-Inf和Inf在面板边缘定位文本 hjust和vjust调整文本对正 dat\u text应该有一列与facet\u grid()或facet\u wrap()一起使用
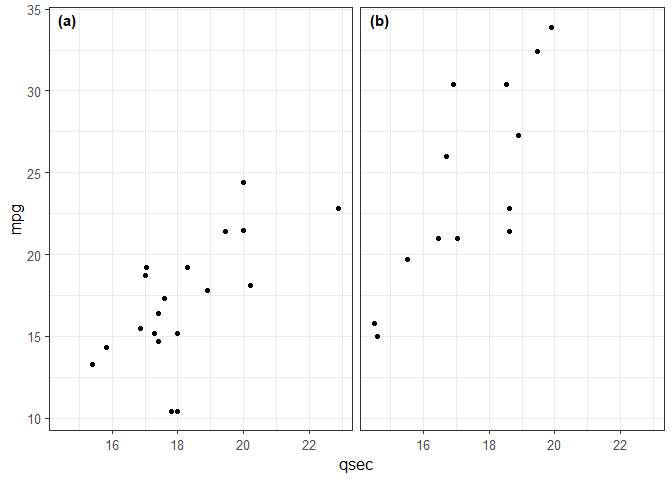
如果有人正在寻找一种简单的方法来标记报告或出版物的方面,那么蛋(CRAN)包具有非常漂亮的tag_facet()
library(ggplot2)

p <- ggplot(mtcars, aes(qsec, mpg)) +
  geom_point() +
  facet_grid(. ~ am) +
  theme_bw(base_size = 12)

# install.packages('egg', dependencies = TRUE)
library(egg)
默认值
tag_facet(p)
注意:如果要保留条带文本和背景,请尝试添加strip。文本和条带。背景返回主题或删除主题(strip.text=element_blank(),strip。background=element\u blank())来自原始的tag\u facet()函数。
tag_facet <- function(p, open = "(", close = ")", tag_pool = letters, x = -Inf, y = Inf,
                      hjust = -0.5, vjust = 1.5, fontface = 2, family = "", ...) {

  gb <- ggplot_build(p)
  lay <- gb$layout$layout
  tags <- cbind(lay, label = paste0(open, tag_pool[lay$PANEL], close), x = x, y = y)
  p + geom_text(data = tags, aes_string(x = "x", y = "y", label = "label"), ..., hjust = hjust,
                vjust = vjust, fontface = fontface, family = family, inherit.aes = FALSE)
}
右上对齐
tag_facet(p, x = Inf, y = Inf,
          hjust = 1.5,
          tag_pool = as.roman(1:nlevels(factor(mtcars$am))))

左下角对齐
tag_facet(p,
          x = -Inf, y = -Inf,
          vjust = -1,
          open = "", close = ")",
          tag_pool = LETTERS)

定义自己的标签
my_tag <- c("i) 4 cylinders", "ii) 6 cyls")
tag_facet(p,
          x = -Inf, y = -Inf,
          vjust = -1, hjust = -0.25,
          open = "", close = "",
          fontface = 4,
          size = 5,
          family = "serif",
          tag_pool = my_tag)

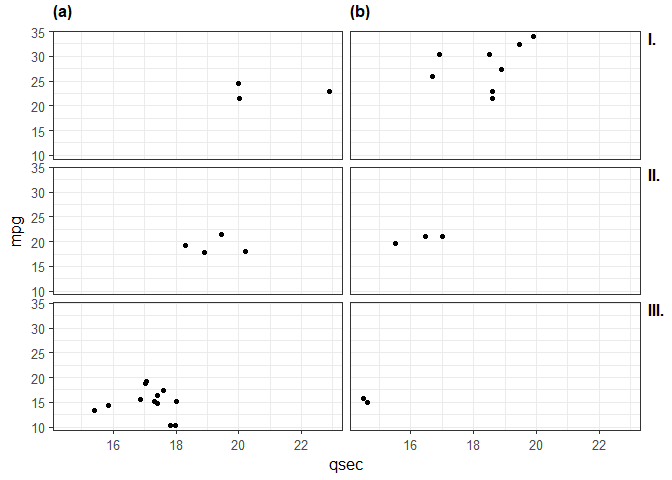
p2 <- ggplot(mtcars, aes(qsec, mpg)) +
  geom_point() +
  facet_grid(cyl ~ am, switch = 'y') +
  theme_bw(base_size = 12) +
  theme(strip.placement = 'outside')

tag_facet_outside(p2)
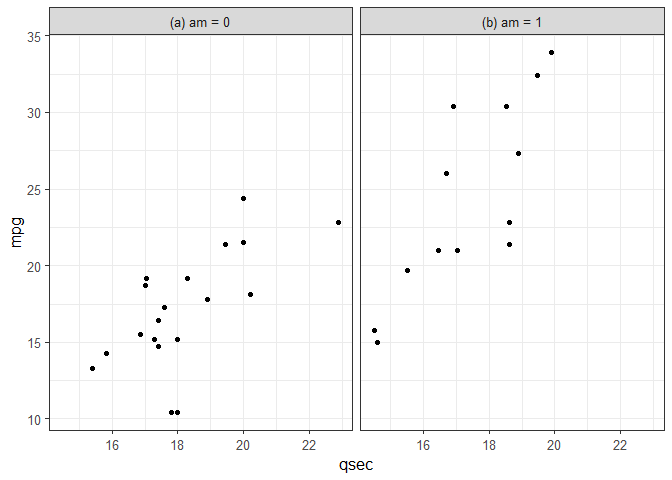
编辑:使用stickylabeller包添加另一个备选方案
- `.n` numbers the facets numerically: `"1"`, `"2"`, `"3"`...
- `.l` numbers the facets using lowercase letters: `"a"`, `"b"`, `"c"`...
- `.L` numbers the facets using uppercase letters: `"A"`, `"B"`, `"C"`...
- `.r` numbers the facets using lowercase Roman numerals: `"i"`, `"ii"`, `"iii"`...
- `.R` numbers the facets using uppercase Roman numerals: `"I"`, `"II"`, `"III"`...

# devtools::install_github("rensa/stickylabeller")
library(stickylabeller)

ggplot(mtcars, aes(qsec, mpg)) +
  geom_point() +
  facet_wrap(. ~ am,
             labeller = label_glue('({.l}) am = {am}')) +
  theme_bw(base_size = 12)
由reprex软件包(v0.2.1)创建的
