
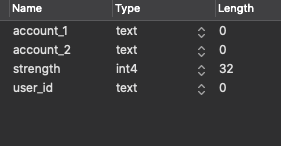
我的PostgreSQL数据库中有两个表(tb_accounts和tb_similar_accounts)。
TB_Accounts中的每个记录都有唯一的ID字段。

在tb_similar_accounts表中,我们存储帐户之间的关系。 我们在这个表中有大约一千万条记录。
我在一个APIendpoint中获得大约1000~4000个帐户,我想从tb_similar_accounts中获得所有链接
const ids_str = `${ids.map((id) => `('${id}')`).join(`,`)}`;

const pgQuery = `
    SELECT account_1 as source, account_2 as target, strength as weight FROM tb_similar_accounts
    WHERE account_1 = ANY (VALUES ${ids_str}) AND account_2 = ANY (VALUES ${ids_str})
    ORDER BY strength DESC
    LIMIT 10000
`;

const { rows: visEdges } = await pgClient.query(pgQuery);
这就是我在这里做的,但这花了太多时间。 它需要超过30秒,所以它在Heroku服务器上失败了。
Limit  (cost=296527.60..297597.60 rows=10000 width=30) (actual time=25075.977..25078.602 rows=10000 loops=1)
  Buffers: shared hit=19 read=121634
  I/O Timings: read=22104.502
  ->  Gather Merge  (cost=296527.60..297967.40 rows=13456 width=30) (actual time=25075.975..25080.332 rows=10000 loops=1)
        Workers Planned: 1
        Workers Launched: 1
        Buffers: shared hit=110 read=244343
        I/O Timings: read=44196.556
        ->  Sort  (cost=295527.60..295534.33 rows=13456 width=30) (actual time=25070.720..25071.022 rows=5546 loops=2)
              Sort Key: tb_similar_accounts.strength DESC
              Sort Method: top-N heapsort  Memory: 1550kB
              Worker 0:  Sort Method: top-N heapsort  Memory: 1550kB
              Buffers: shared hit=110 read=244343
              I/O Timings: read=44196.556
              ->  Hash Semi Join  (cost=5.74..295343.04 rows=13456 width=30) (actual time=1040.173..25060.553 rows=38449 loops=2)
                    Hash Cond: (tb_similar_accounts.account_1 = "*VALUES*".column1)
                    Buffers: shared hit=63 read=244343
                    I/O Timings: read=44196.556
                    ->  Hash Semi Join  (cost=2.87..295096.26 rows=381936 width=30) (actual time=2.197..25039.864 rows=80874 loops=2)
                          Hash Cond: (tb_similar_accounts.account_2 = "*VALUES*_1".column1)
                          Buffers: shared hit=33 read=244343
                          I/O Timings: read=44196.556
                          ->  Parallel Seq Scan on tb_similar_accounts  (cost=0.00..286491.44 rows=14038480 width=30) (actual time=0.032..23394.824 rows=11932708 loops=2)
                                Buffers: shared hit=33 read=244343
                                I/O Timings: read=44196.556
                          ->  Hash  (cost=1.44..1.44 rows=410 width=32) (actual time=0.241..0.242 rows=410 loops=2)
                                Buckets: 1024  Batches: 1  Memory Usage: 26kB
                                ->  Values Scan on "*VALUES*_1"  (cost=0.00..1.44 rows=410 width=32) (actual time=0.001..0.153 rows=410 loops=2)
                    ->  Hash  (cost=1.44..1.44 rows=410 width=32) (actual time=0.198..0.198 rows=410 loops=2)
                          Buckets: 1024  Batches: 1  Memory Usage: 26kB
                          ->  Values Scan on "*VALUES*"  (cost=0.00..1.44 rows=410 width=32) (actual time=0.002..0.113 rows=410 loops=2)
Planning Time: 3.522 ms
Execution Time: 25081.725 ms
这是为410个帐户和大约25秒。
有什么方法可以改进这个查询吗? (我使用的是node.js和pg模块。)
检查两个表的索引是否正确,例如,尝试在连接两个表时使用的列上建立索引。
